


Armed conflicts produce complex and interconnected impacts that extend beyond direct violence to affect infrastructure systems, environmental conditions, and civilian populations. Understanding these dynamics requires analytical frameworks capable of integrating multiple spatial indicators of disruption and vulnerability. This study examines spatial patterns of civilian vulnerability in Ukraine following the 2022 Russian invasion using a multi-indicator geospatial framework that combines satellite-derived, modeled, and event-based datasets. Indicators analyzed include nighttime lights derived from the VIIRS Black Marble dataset, conflict events from the Armed Conflict Location and Event Data Project (ACLED), gridded population estimates from WorldPop, modeled particulate matter concentrations from the Copernicus Atmosphere Monitoring Service (CAMS), vegetation conditions derived from the Normalized Difference Vegetation Index (NDVI), and baseline hydrological stress from the Aqueduct water risk dataset. To standardize spatial comparison across datasets with differing resolutions, all indicators were aggregated to a 5-km hexagonal spatial grid covering Ukraine. Results reveal pronounced declines in nighttime radiance across eastern and southern regions of the country, corresponding with areas experiencing sustained military activity and energy infrastructure disruption. Conflict events are concentrated along eastern frontlines, while substantial civilian populations remain present in several regions experiencing infrastructure instability. Environmental indicators further reveal spatial variation in vegetation dynamics, air quality conditions, and baseline water stress. The convergence of these indicators highlights regions where multiple dimensions of vulnerability intersect. The findings demonstrate that civilian vulnerability in wartime Ukraine is shaped not only by the geography of violence but also by the interaction of infrastructure disruption, environmental stress, and population exposure. More broadly, the study illustrates how integrating remote sensing and geospatial datasets can provide a comprehensive perspective on the spatial consequences of armed conflict.
Geography Joe March 15 2026Research
Mapping Civillian Vulnerability in War-time Ukraine: A Multi-Indicator Geospatial Analysis of Infrastructure Disruption, Environmental Stress, and Population Exposure
Abstract
Introduction
Armed conflicts reshape landscapes in ways that extend far beyond the immediate geography of military engagement. While violent encounters and territorial shifts often dominate representations of warfare, conflicts frequently generate broader infrastructural, environmental, and social disruptions that influence civilian populations long after active hostilities occur. Modern warfare increasingly involves attacks on energy infrastructure, industrial facilities, and transportation systems that support everyday economic and social life. The resulting disruptions may propagate across interconnected infrastructure networks, affecting regions distant from the original sites of military activity. Understanding how these disruptions intersect with population distribution and environmental conditions is therefore critical for assessing civilian vulnerability in conflict environments.
Scholars working within the framework of warfare ecology have emphasized that armed conflict should be understood as a socio-ecological disturbance that affects both human and environmental systems simultaneously (Machlis & Hanson, 2011). Military operations can damage ecosystems, disrupt agricultural systems, contaminate water and soil resources, and degrade environmental quality. These impacts often interact with existing environmental constraints, producing cascading effects that influence livelihoods, resource availability, and long-term recovery prospects. In addition to environmental impacts, modern conflicts frequently disrupt infrastructure systems that support urban and rural populations. Electricity networks, water supply systems, transportation corridors, and communication infrastructure are increasingly targeted or indirectly damaged during warfare. Because these systems operate at regional or national scales, disruptions can extend well beyond frontline areas.
The Russian invasion of Ukraine beginning in February 2022 provides a particularly significant context for examining these dynamics. The conflict has involved extensive attacks on energy infrastructure, including power plants, substations, and transmission networks. Missile strikes targeting electrical infrastructure have periodically disrupted electricity supply across large portions of the country, especially during winter months when energy demand is high. In addition to energy infrastructure, military activity has affected industrial facilities, agricultural regions, and transportation systems that support civilian livelihoods. These disruptions have occurred alongside large-scale population displacement, creating complex spatial patterns of vulnerability across the country.
Although traditional conflict analyses often focus on the spatial distribution of violent events or casualty counts, such indicators provide only a partial representation of the broader impacts of war. Civilian vulnerability is shaped not only by the locations where violence occurs but also by the stability of infrastructure systems, environmental conditions, and population exposure to disruption. Integrating these factors requires analytical approaches capable of combining multiple spatial datasets that describe different dimensions of conflict impact.
Advances in satellite remote sensing and open geospatial data have created new opportunities for studying these processes. Satellite observations can reveal patterns of infrastructure disruption, land-use change, environmental stress, and economic activity across large geographic areas. Nighttime lights data derived from satellite sensors have been widely used to monitor electricity availability and economic activity, while vegetation indices and atmospheric models provide indicators of environmental conditions. When combined with conflict event data and population estimates, these datasets enable researchers to examine how environmental and infrastructural disruptions intersect with patterns of violence and civilian exposure.
This study develops a multi-indicator geospatial framework to examine spatial patterns of civilian vulnerability in wartime Ukraine. By integrating satellite-derived nighttime lights, conflict event data, population distribution, environmental indicators, and hydrological stress metrics, the analysis identifies regions where multiple forms of disruption intersect. To enable consistent spatial comparison across datasets with differing resolutions, all indicators are aggregated to a hexagonal spatial grid covering the country. This approach allows spatial patterns across indicators to be compared directly, revealing areas where infrastructure disruption, environmental stress, and population exposure converge.
Literature Review
Environmental Impacts of Armed Conflict
Armed conflict can produce extensive environmental and infrastructural disruption that persists long after hostilities end. Warfare ecology research highlights how military activities affect ecosystems, resource availability, and environmental quality through processes such as industrial damage, land-use change, pollution, and infrastructure destruction (Machlis & Hanson, 2011). These disruptions often create cascading effects across both ecological and social systems, influencing livelihoods, economic stability, and environmental health.
Modern conflicts frequently involve damage to industrial facilities and energy infrastructure that support civilian populations. Attacks on industrial sites can release pollutants into the atmosphere and surrounding ecosystems, while damage to transportation and energy networks can disrupt supply chains and reduce access to essential services. Studies examining the environmental consequences of warfare have documented impacts ranging from habitat destruction and biodiversity loss to contamination of soil and water resources (Lawrence et al., 2015). These environmental effects often complicate post conflict recovery because damaged ecosystems and degraded infrastructure require long term restoration efforts.
The war in Ukraine has drawn increasing attention from researchers examining environmental impacts of conflict. Industrial regions in eastern Ukraine host numerous energy facilities, chemical plants, and heavy industry that present environmental risks when damaged during military operations. Early assessments of the war have highlighted potential risks associated with industrial damage, agricultural disruption, and pollution caused by infrastructure destruction. Monitoring these impacts requires analytical frameworks capable of combining environmental indicators with conflict and infrastructure data.
Remote Sensing and Conflict Monitoring
Satellite remote sensing has emerged as an important tool for studying the environmental and infrastructural consequences of armed conflict. Remote sensing provides spatially continuous observations that allow researchers to monitor environmental change, infrastructure damage, and land-surface changes across large geographic areas (Witmer, 2015). Because satellite imagery can be collected repeatedly over time, it enables the analysis of both spatial and temporal patterns associated with conflict impacts.
Remote sensing approaches have been used to detect urban destruction, agricultural abandonment, and environmental degradation in conflict zones. Satellite imagery can also provide indicators of economic activity, population displacement, and infrastructure functioning. These methods are particularly valuable in regions where ground based data collection is limited due to security constraints or logistical challenges.
Integrating satellite data with other geospatial datasets further expands analytical possibilities. Conflict event datasets provide information about the locations and characteristics of violent events, while population datasets allow researchers to estimate civilian exposure to environmental and infrastructural disruption. By combining these datasets, researchers can develop multi-dimensional frameworks for understanding the spatial consequences of war.
Nighttime Lights as Indicators of Infrastructure Disruption
Satellite derived nighttime lights have bec me widely used indicators of economic activity, urbanization, and infrastructure functioning. The Visible Infrared Imaging Radiometer Suite (VIIRS) Day/Night Band provides global measurements of nighttime radiance that capture artificial lighting associated with human settlements and infrastructure systems (Elvidge et al., 2017). The NASA Black Marble dataset improves the reliability of these measurements by applying corrections for atmospheric conditions, lunar illumination, and stray light contamination (Román et al., 2018).
Because electric lighting is closely associated with infrastructure systems and economic activity, changes in nighttime brightness can indicate disruptions to electricity supply or population displacement. Studies have used nighttime lights data to monitor power outages following natural disasters, economic decline, and infrastructure disruption during conflicts. In the context of the war in Ukraine, nighttime lights analysis has been used to identify regions experiencing electricity shortages and infrastructure disruption (Zheng et al., 2022).
Population Exposure and Conflict Event Data
Assessing civilian vulnerability requires understanding where populations remain present in conflict-affected regions. Gridded population datasets such as WorldPop redistribute census data into high resolution spatial grids using modeling techniques that incorporate settlement patterns, land use, and environmental variables (Tatem, 2017). These datasets enable analysis of population exposure to environmental hazards, disruption, and conflict events.
Conflict event datasets provide complementary information about the spatial distribution of violence. The Armed Conflict Location and Event Data Project (ACLED) records georeferenced events including battles, explosions, and violence against civilians (Raleigh et al., 2010). Aggregating these events spatially allows researchers to identify geographic patterns of conflict intensity and examine how violence interacts with infrastructure and environmental conditions.
Data & Methods
Data Sources
This study integrates multiple geospatial datasets representing different dimensions of wartime disruption and vulnerability. Satellite derived nighttime lights data were obtained from the VIIRS VNP46A2 Black Marble dataset, which provides corrected nighttime radiance measurements at high temporal frequency. Population distribution was represented using WorldPop gridded population estimates, which redistribute census counts using spatial modeling techniques.
Conflict intensity was measured using event records from the Armed Conflict Location and Event Data Project (ACLED). Environmental indicators included modeled PM₂.₅ concentrations from the Copernicus Atmosphere Monitoring Service atmospheric reanalysis dataset, vegetation conditions derived from NDVI measurements, and baseline hydrological stress indicators from the Aqueduct water risk dataset.
Hexagonal Spatial Framework
To enable standardized spatial comparison across datasets with differing resolutions and spatial structures, all indicators were aggregated to a hexagonal spatial grid covering the territory of Ukraine. Each hexagonal cell represents an area approximately five kilometers in diameter. Hexagonal grids are commonly used in spatial analysis because they reduce directional bias and maintain consistent adjacency relationships between neighboring cells (Birch et al., 2007).
Nighttime Lights Baseline
A pre-war baseline of nighttime brightness was constructed using monthly median VIIRS radiance values from 2021. Post-invasion nighttime lights observations were normalized relative to this baseline using a percent-of-baseline metric, allowing spatial identification of infrastructure disruptions.
Results
Infrastructure Disruption
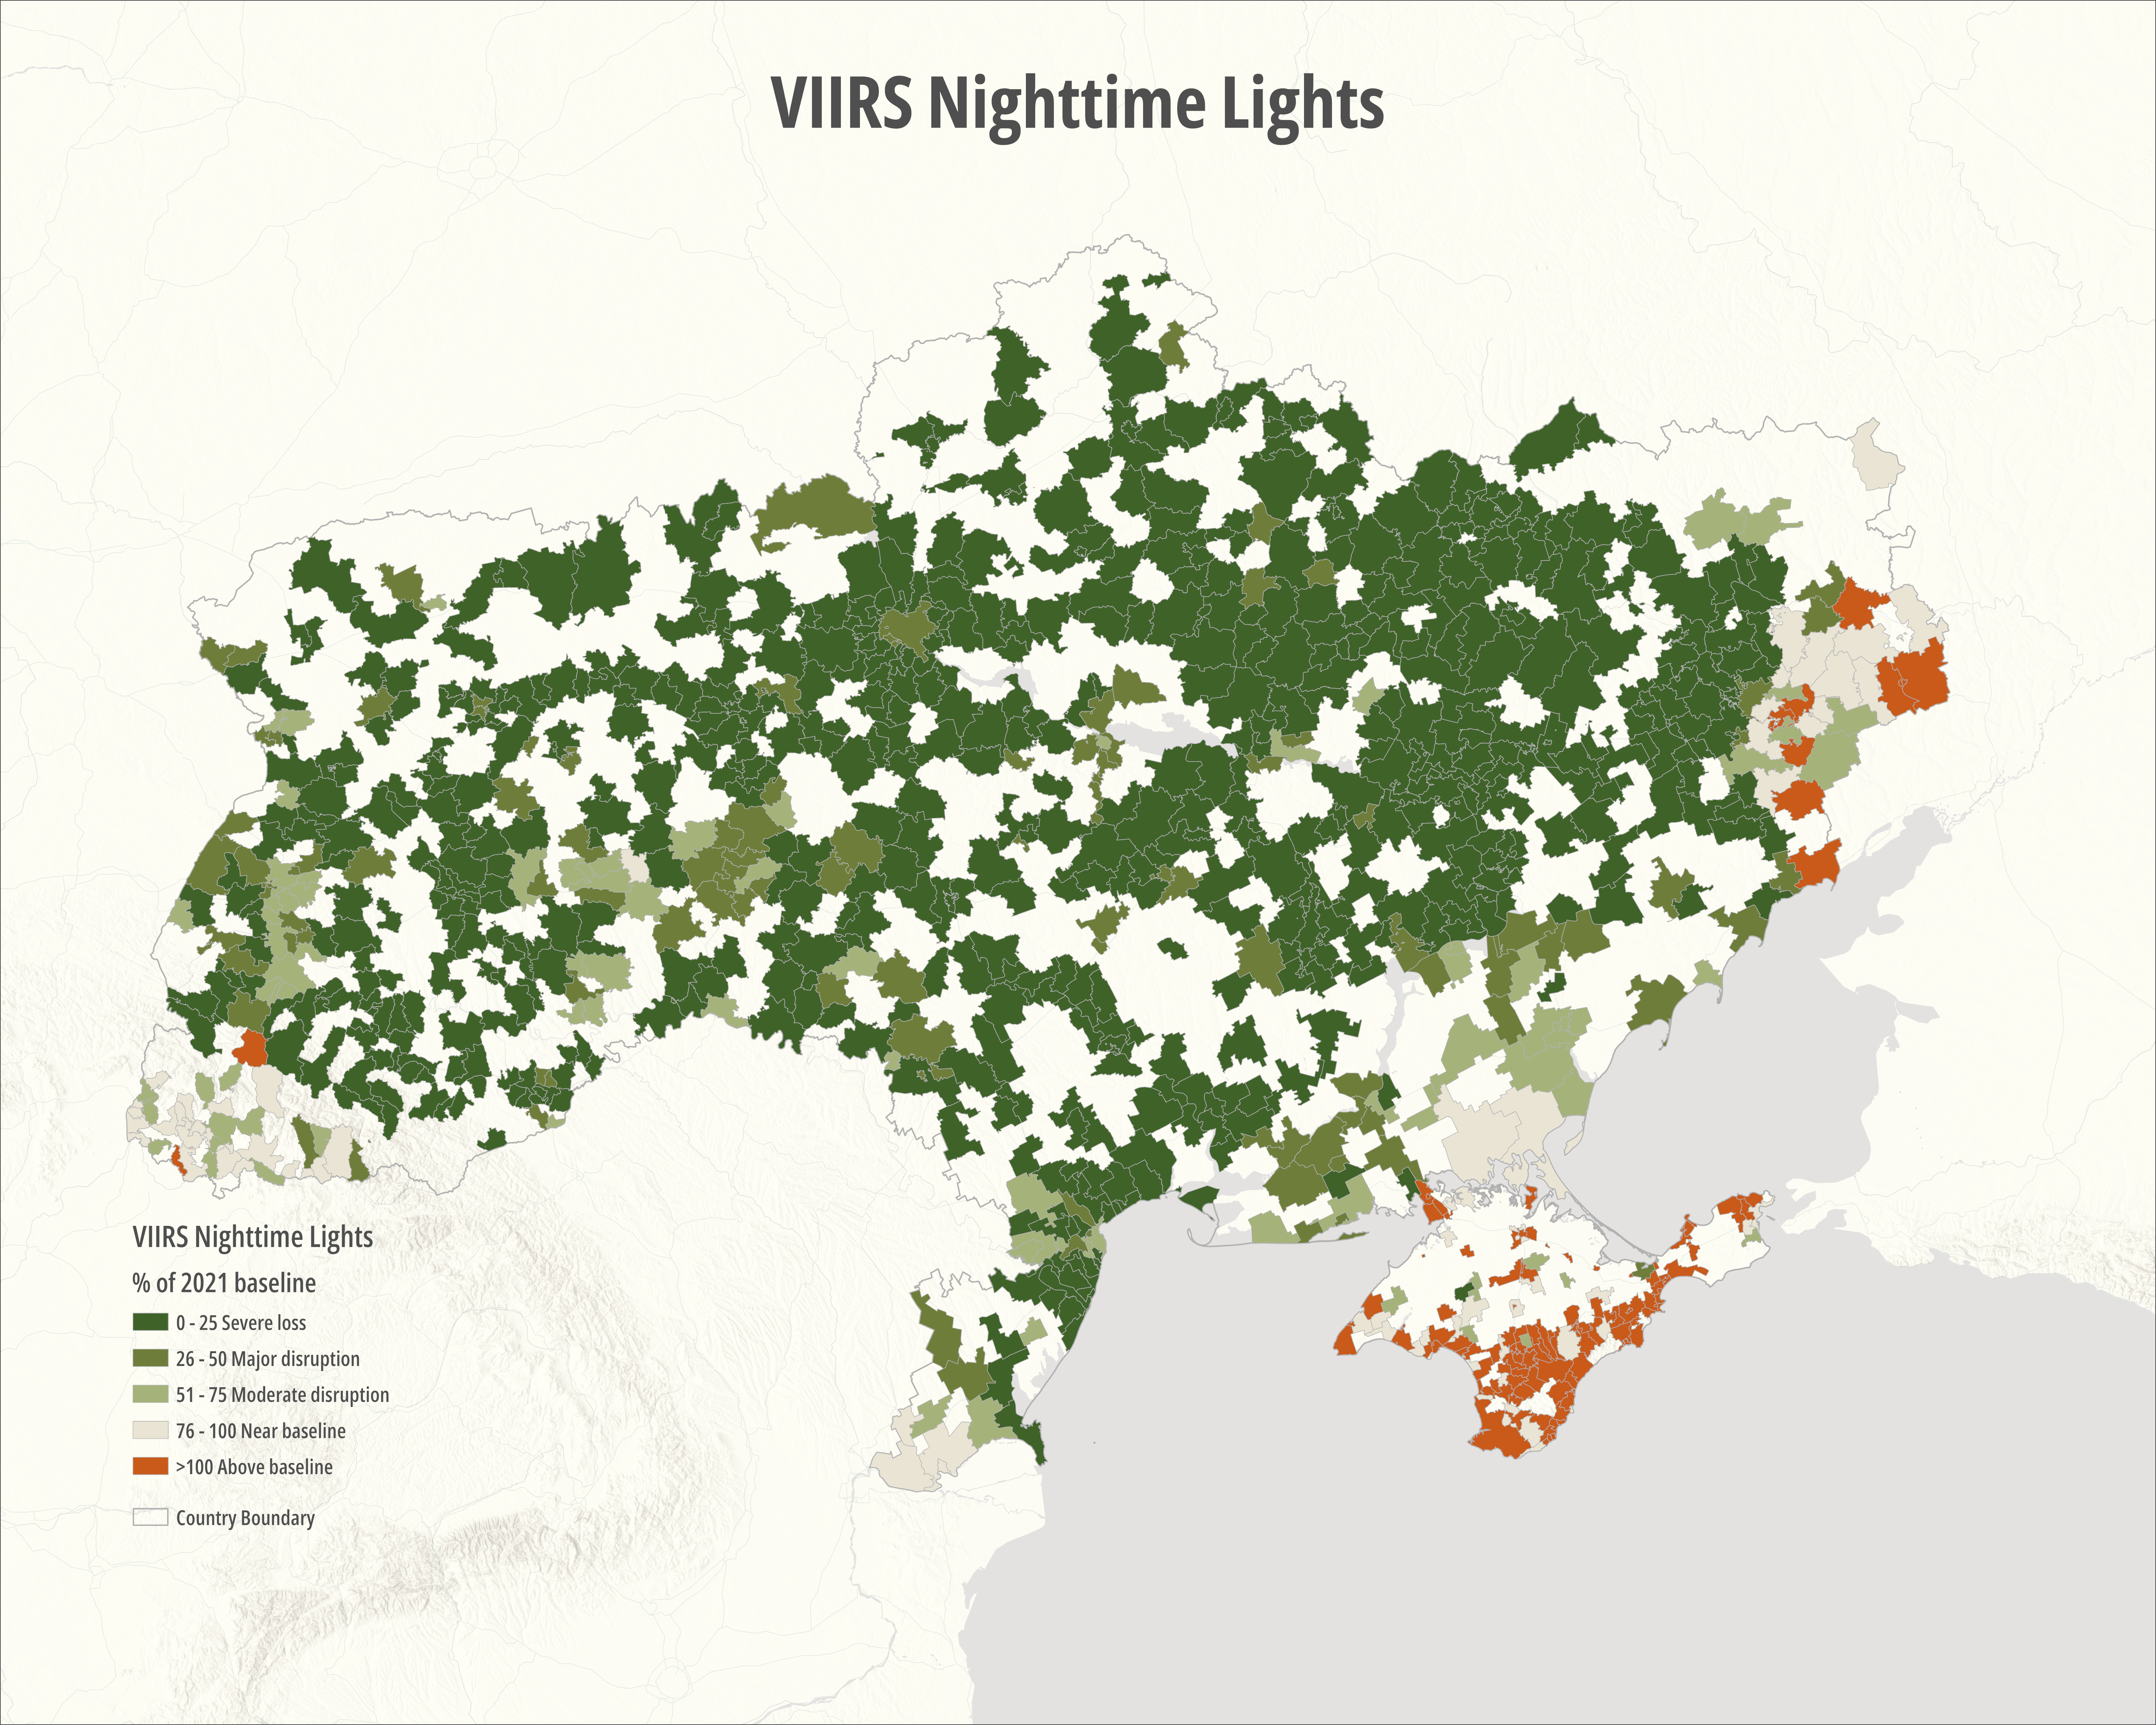
Analysis of nighttime lights data reveals substantial spatial variation in infrastructure activity across Ukraine following the 2022 invasion. When post-invasion radiance values are expressed as a percentage of the 2021 baseline, clear regional patterns emerge. The most pronounced declines in nighttime brightness occur in eastern and southern portions of the country, particularly in regions where sustained military operations and infrastructure targeting have occurred. These areas include parts of Donetsk, Luhansk, Zaporizhzhia, and Kherson regions, where energy infrastructure has experienced repeated disruption during the conflict.
Figure 1. below
Declines in nighttime radiance are especially noticeable in, and around urban centers located near major frontlines or critical infrastructure corridors. Such patterns are consistent with disruptions to electricity networks, damage to infrastructure, and reduced economic activity. Because electrical infrastructure operates as an interconnected network, disruptions at key facilities can affect large geographic areas. The spatial distribution of nighttime light declines therefore likely reflects both direct infrastructure damage and secondary disruptions associated with energy network instability.
In contrast, western and central regions of Ukraine generally maintain nighttime radiance values closer to baseline levels. Although these areas have experienced missile strikes and periodic power disruptions, the magnitude and persistence of nighttime light decline appear lower compared to conflict intensive regions in the east and south. These differences illustrate the uneven geographic distribution of wartime infrastructure disruption across the country. Most areas of Crimea demonstrated areas of increased nighttime radiance. These increases may be due to the lack of conflict in the Russian controlled peninsula and an increase in tourism driven by Russian authorities.
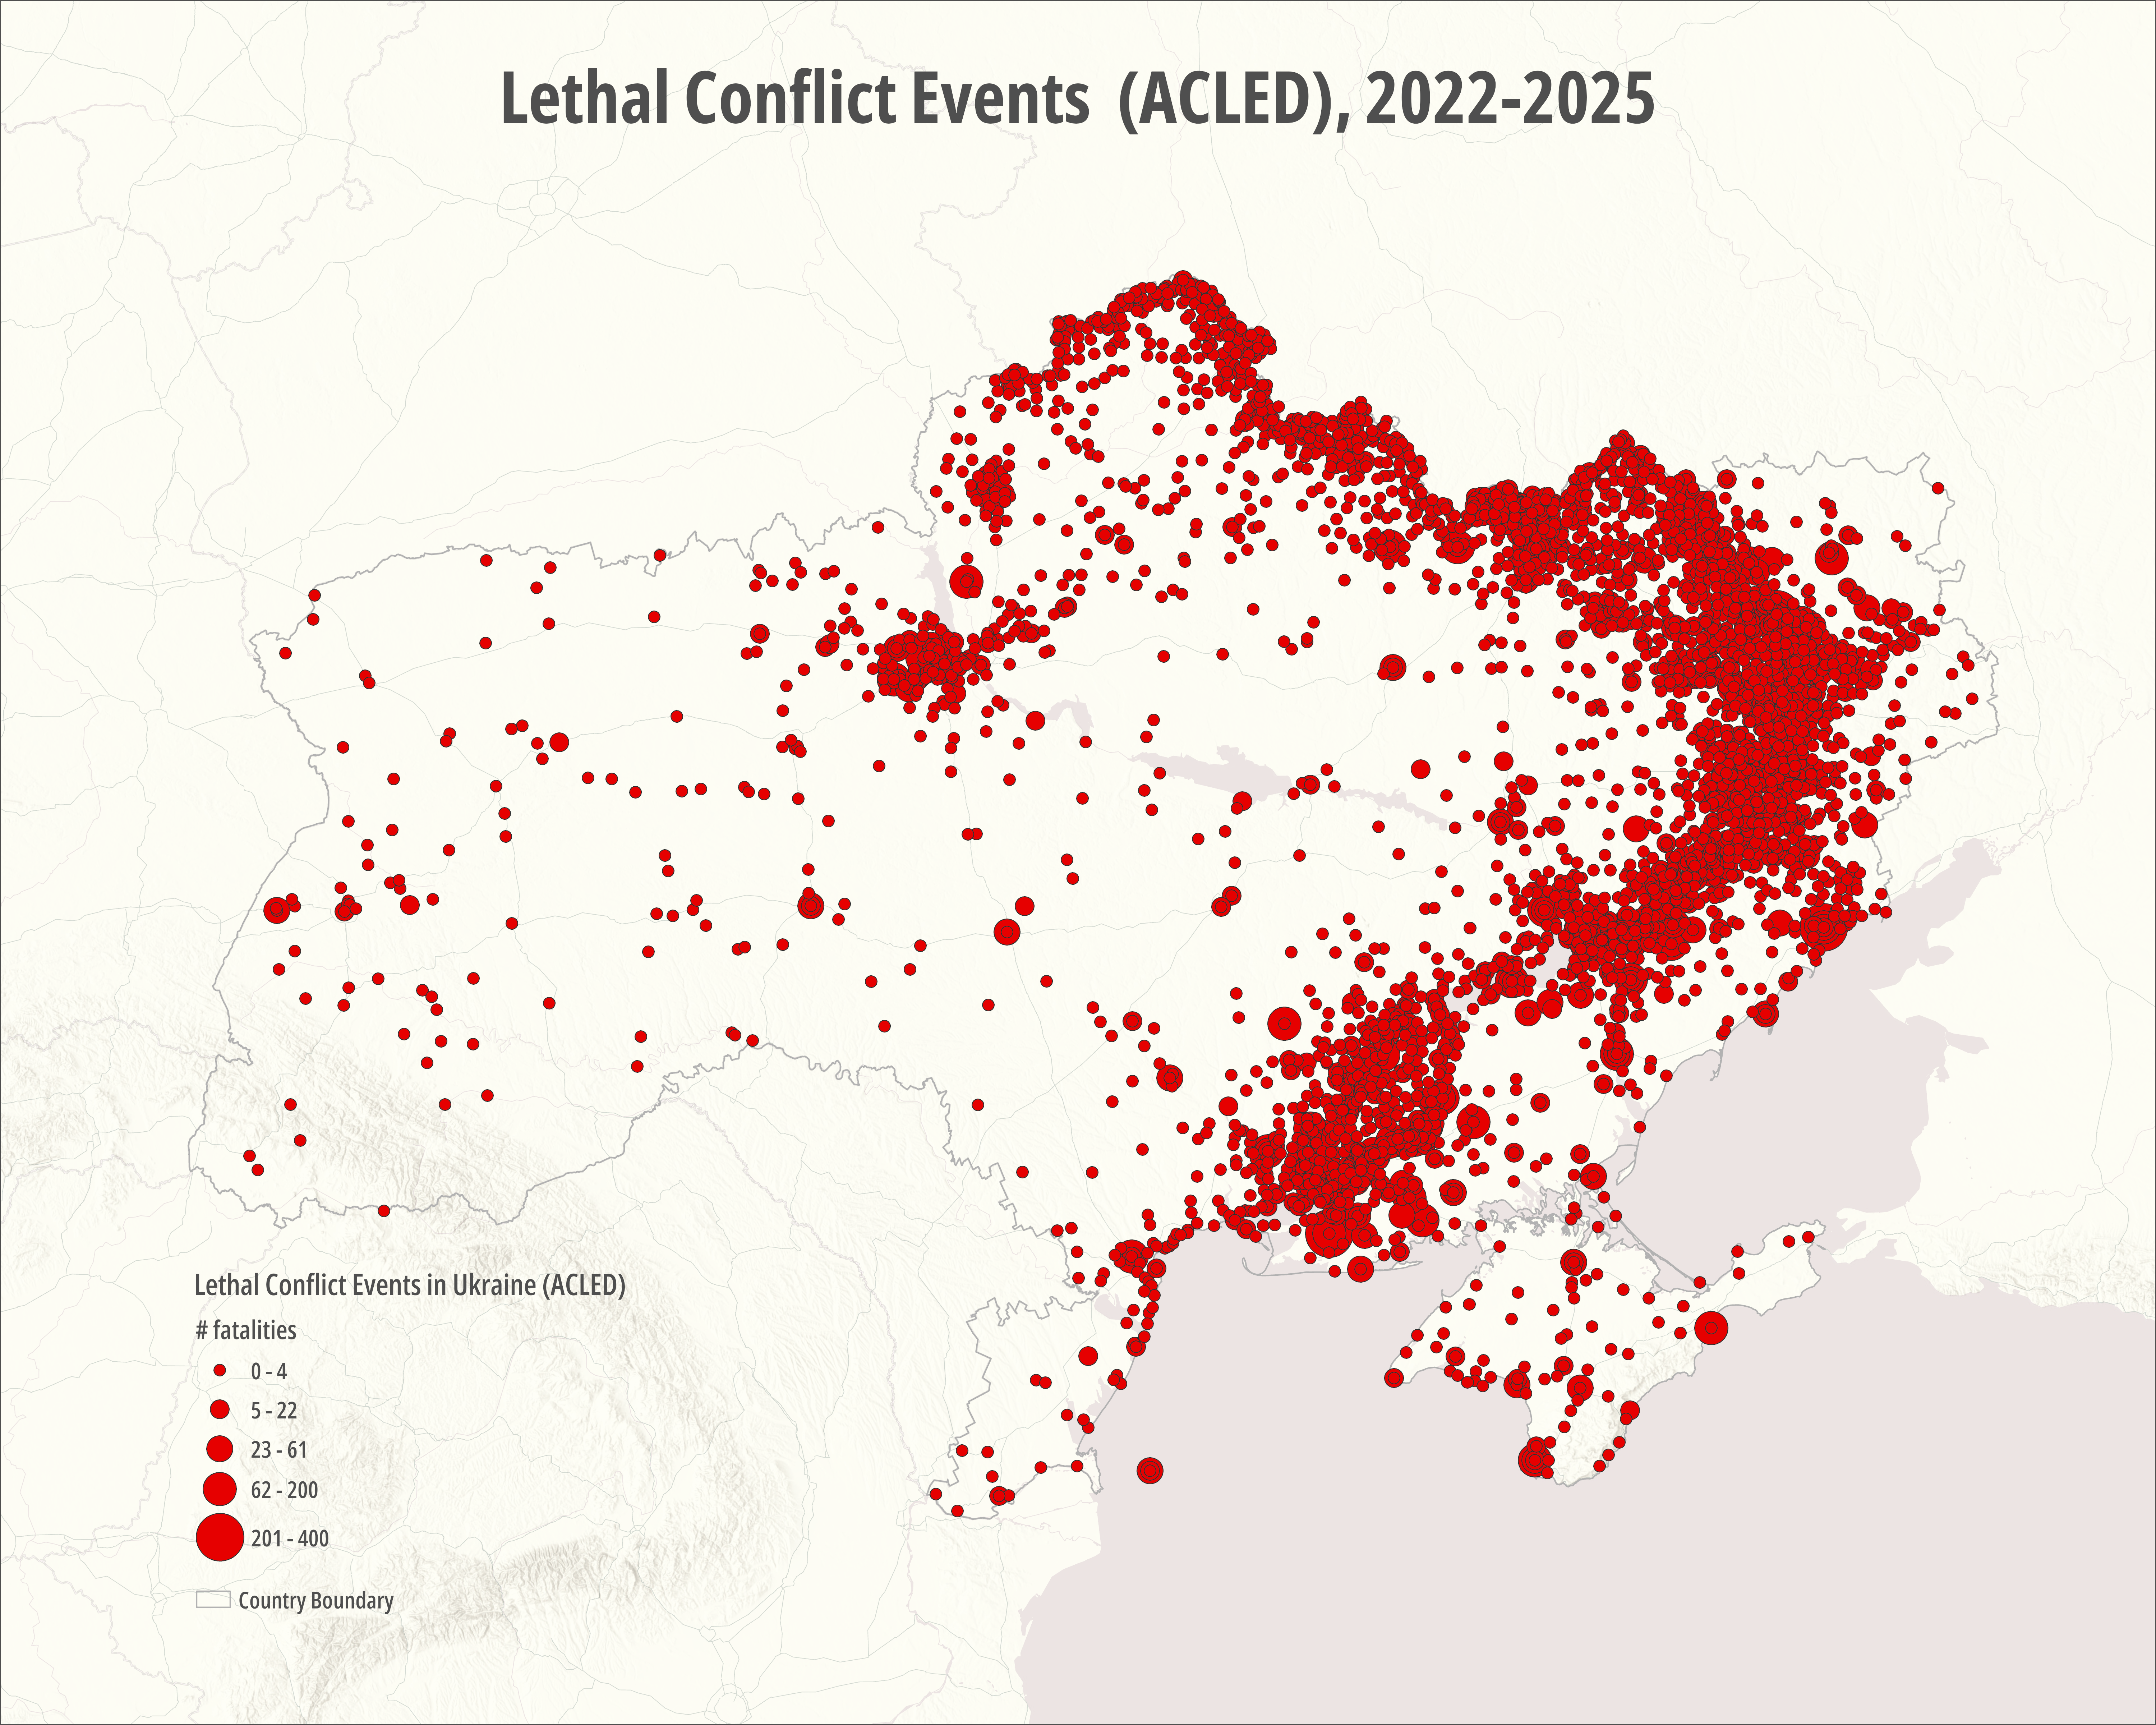
Conflict Intensity
Conflict events recorded in the ACLED dataset reveal strong geographic clustering of violence during the study period.
Figure 2. below
The spatial distribution of conflict events highlights several zones of concentrated military activity. These clusters correspond closely with known frontlines and contested territories during the conflict. However, the distribution of infrastructure disruption extends beyond the immediate locations of violent events. Nighttime lights decline appear across broader areas than those directly associated with recorded conflict events, suggesting that infrastructure impacts propagate through interconnected systems.
This divergence between the geography of violent events and the geography of infrastructure disruption highlights the importance of considering multiple indicators when assessing wartime impacts. Areas experiencing relatively few recorded violent events may still experience infrastructure instability due to network effects or indirect disruptions.
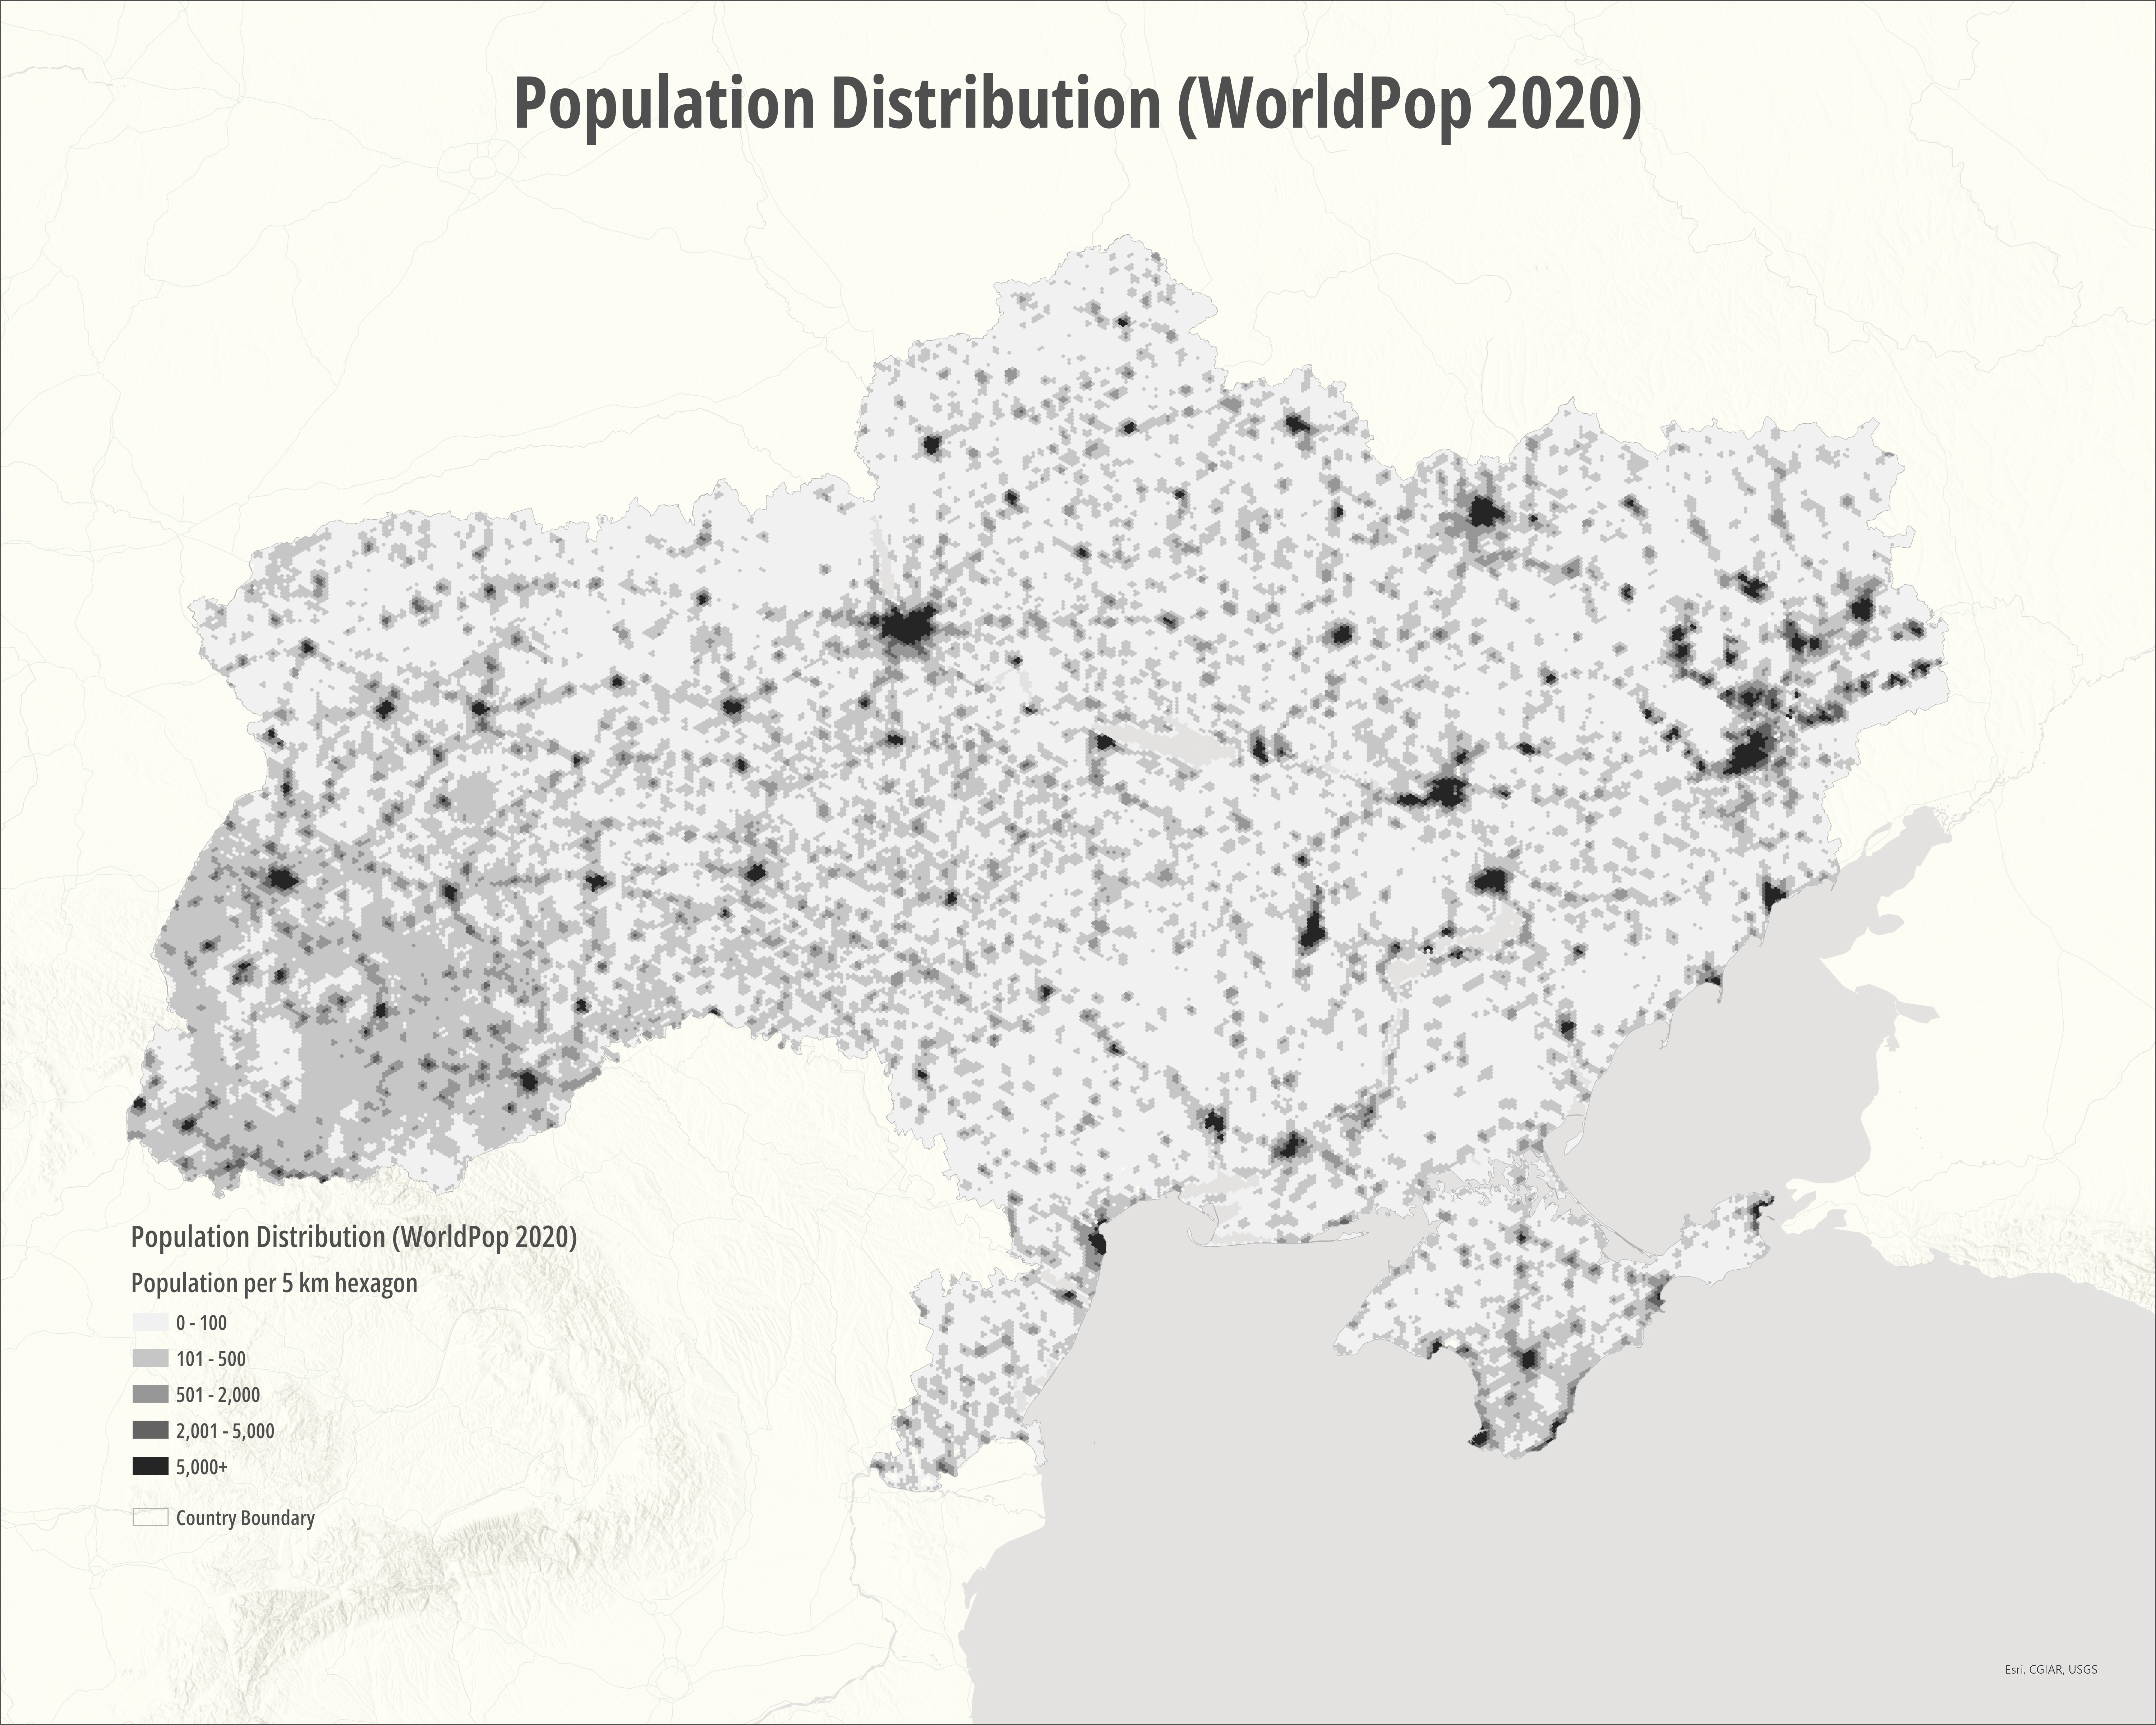
Population Exposure
Population distribution patterns derived from the WorldPop dataset illustrate the spatial distribution of civilian populations across Ukraine. Even after large-scale displacement associated with the conflict, significant population concentrations remain in many urban regions and transportation corridors. Major cities such as Kyiv, Kharkiv, Dnipro, and Odesa continue to represent major population centers despite periodic infrastructure disruptions and security risks.
Figure 3. below
The overlap between population density and infrastructure disruption provides insight into potential humanitarian impacts. Regions where large civilian populations coincide with declines in nighttime brightness may represent areas where infrastructure instability affects large numbers of residents. Such disruptions may influence access to electricity, heating, transportation, and communication services that support everyday life.
In several regions of eastern and southern Ukraine, the spatial intersection of conflict intensity, infrastructure disruption, and population presence suggests particularly challenging conditions for civilian populations. Even where population density has declined due to displacement, substantial numbers of civilians remain in areas experiencing infrastructure instability.
Environmental Indicators
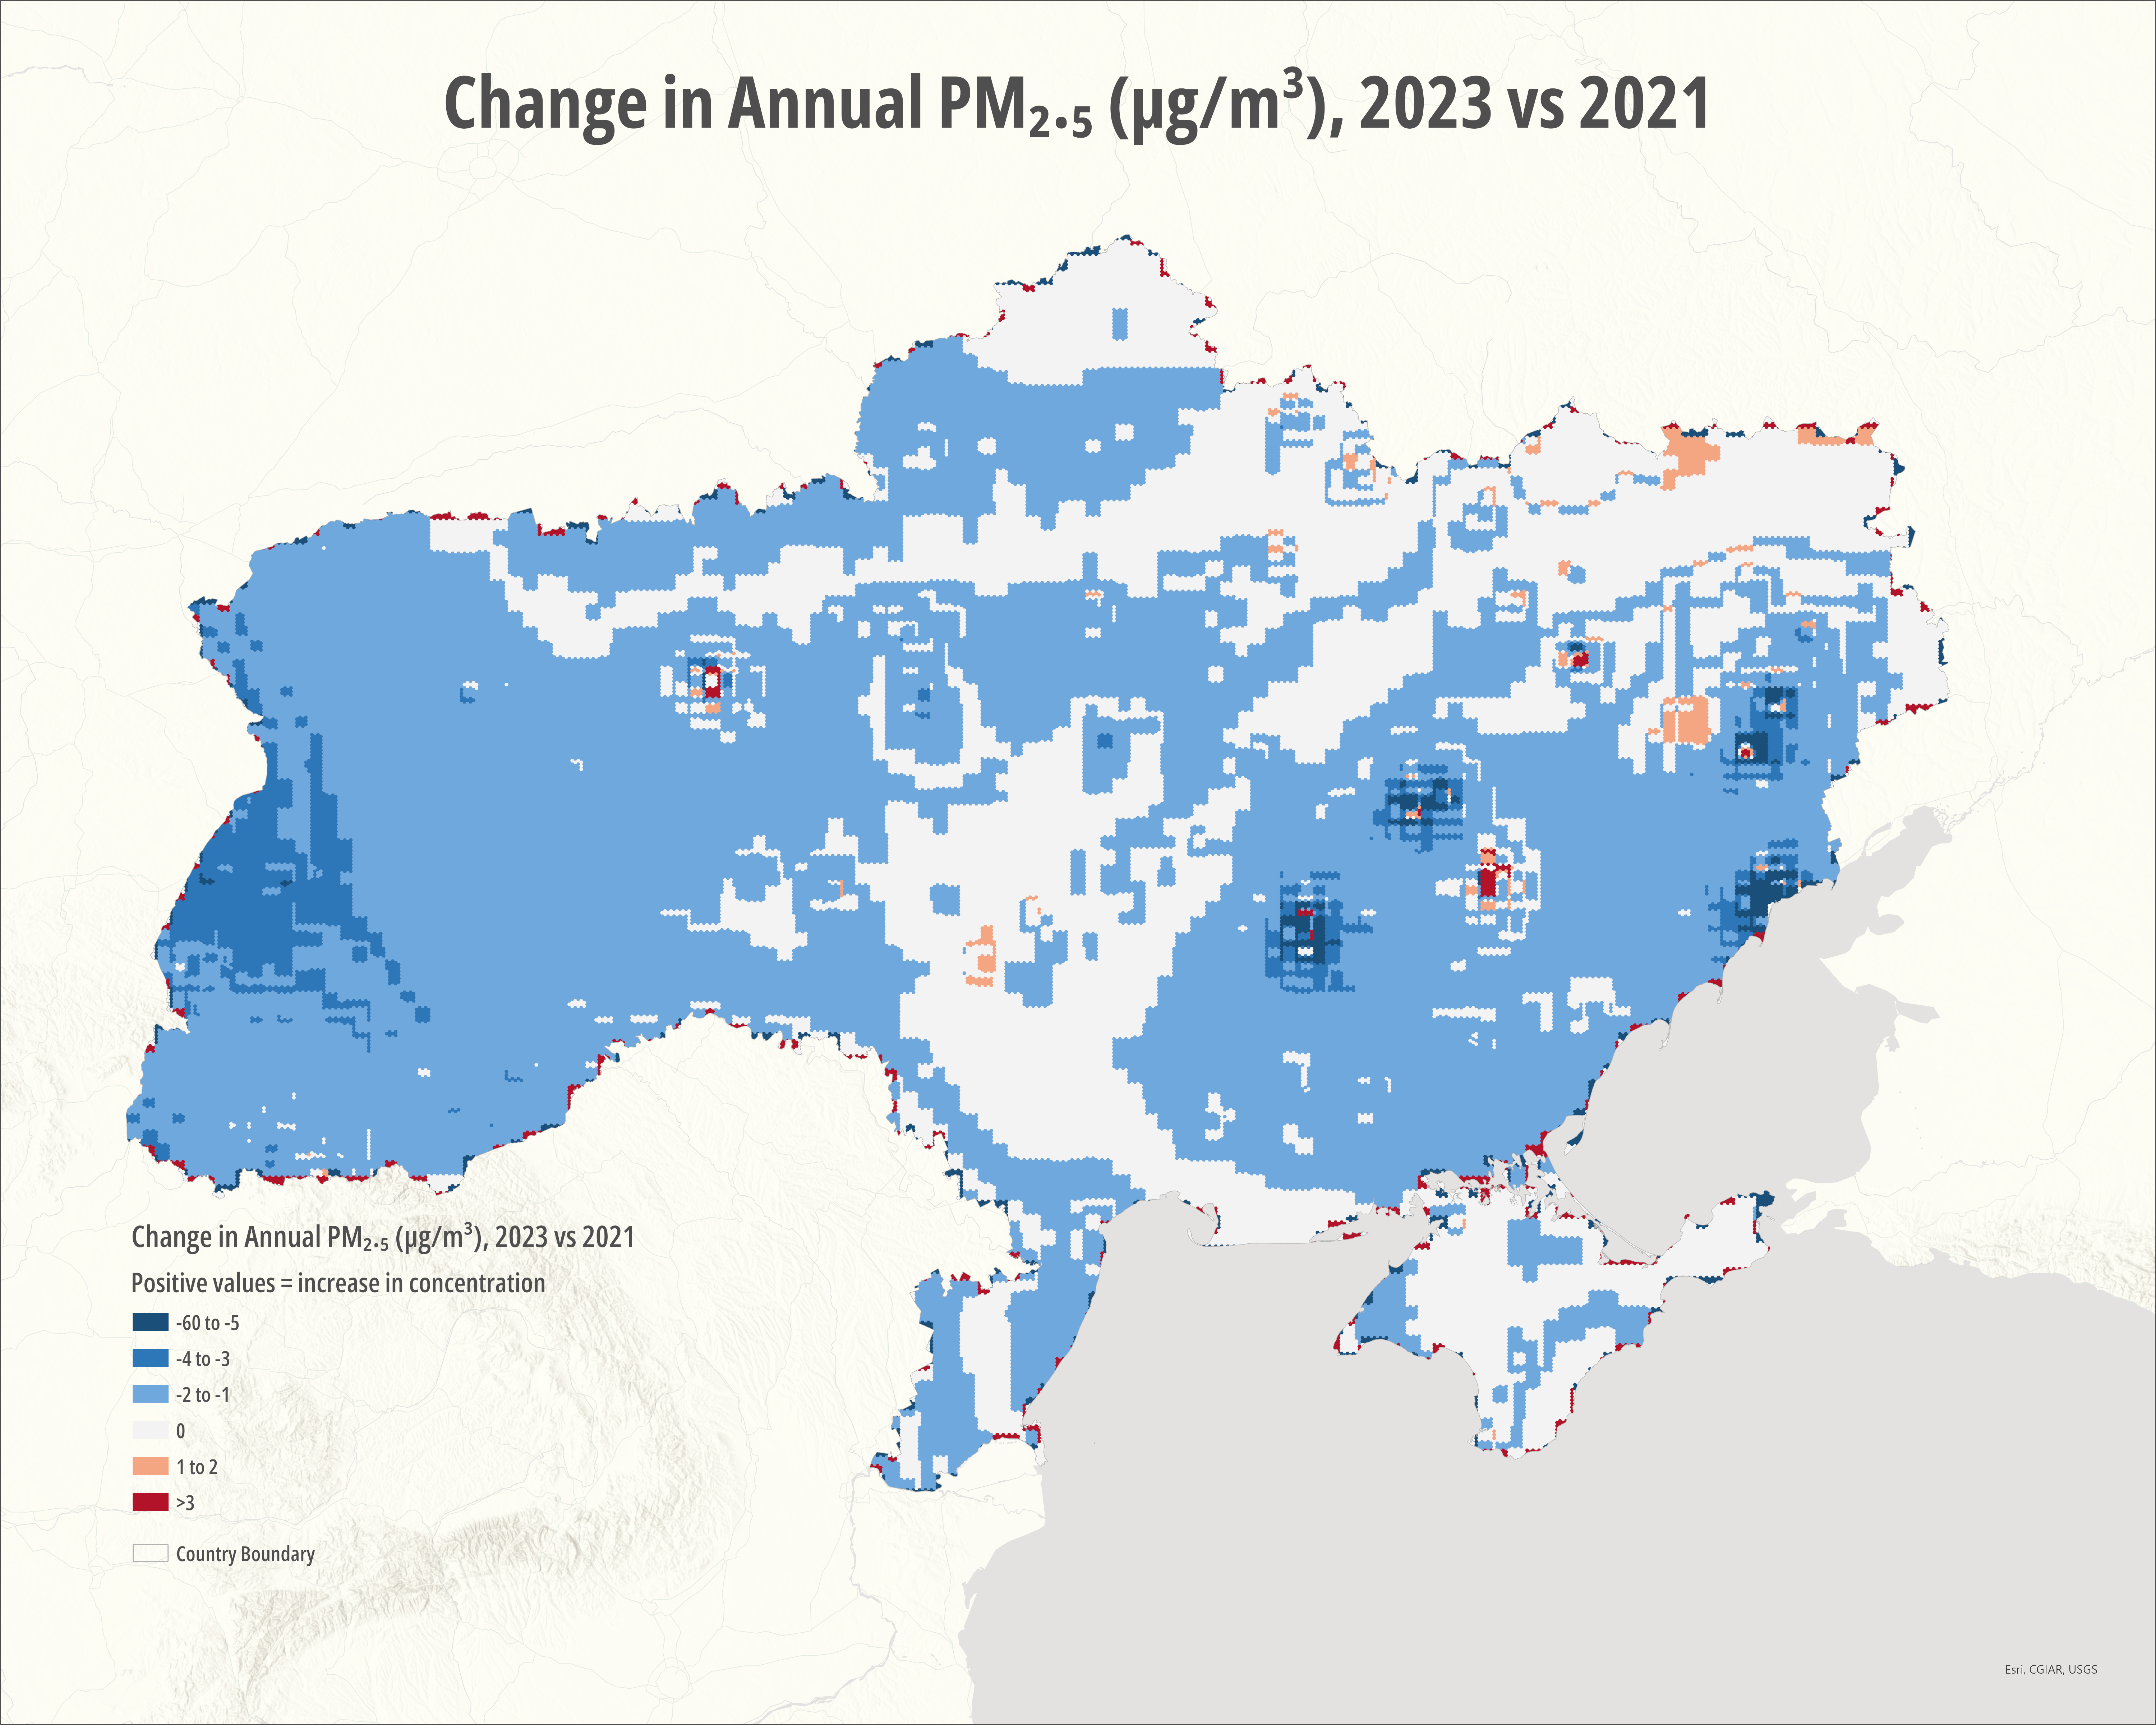
Environmental indicators provide additional context for understanding spatial patterns of vulnerability across Ukraine. Modeled PM₂.₅ concentrations derived from the CAMS atmospheric reanalysis dataset reveal regional variation in air quality conditions. Higher concentrations are observed in several industrial and urban regions, reflecting both background emissions and potential contributions from wartime industrial disruption.
Figure 4. below
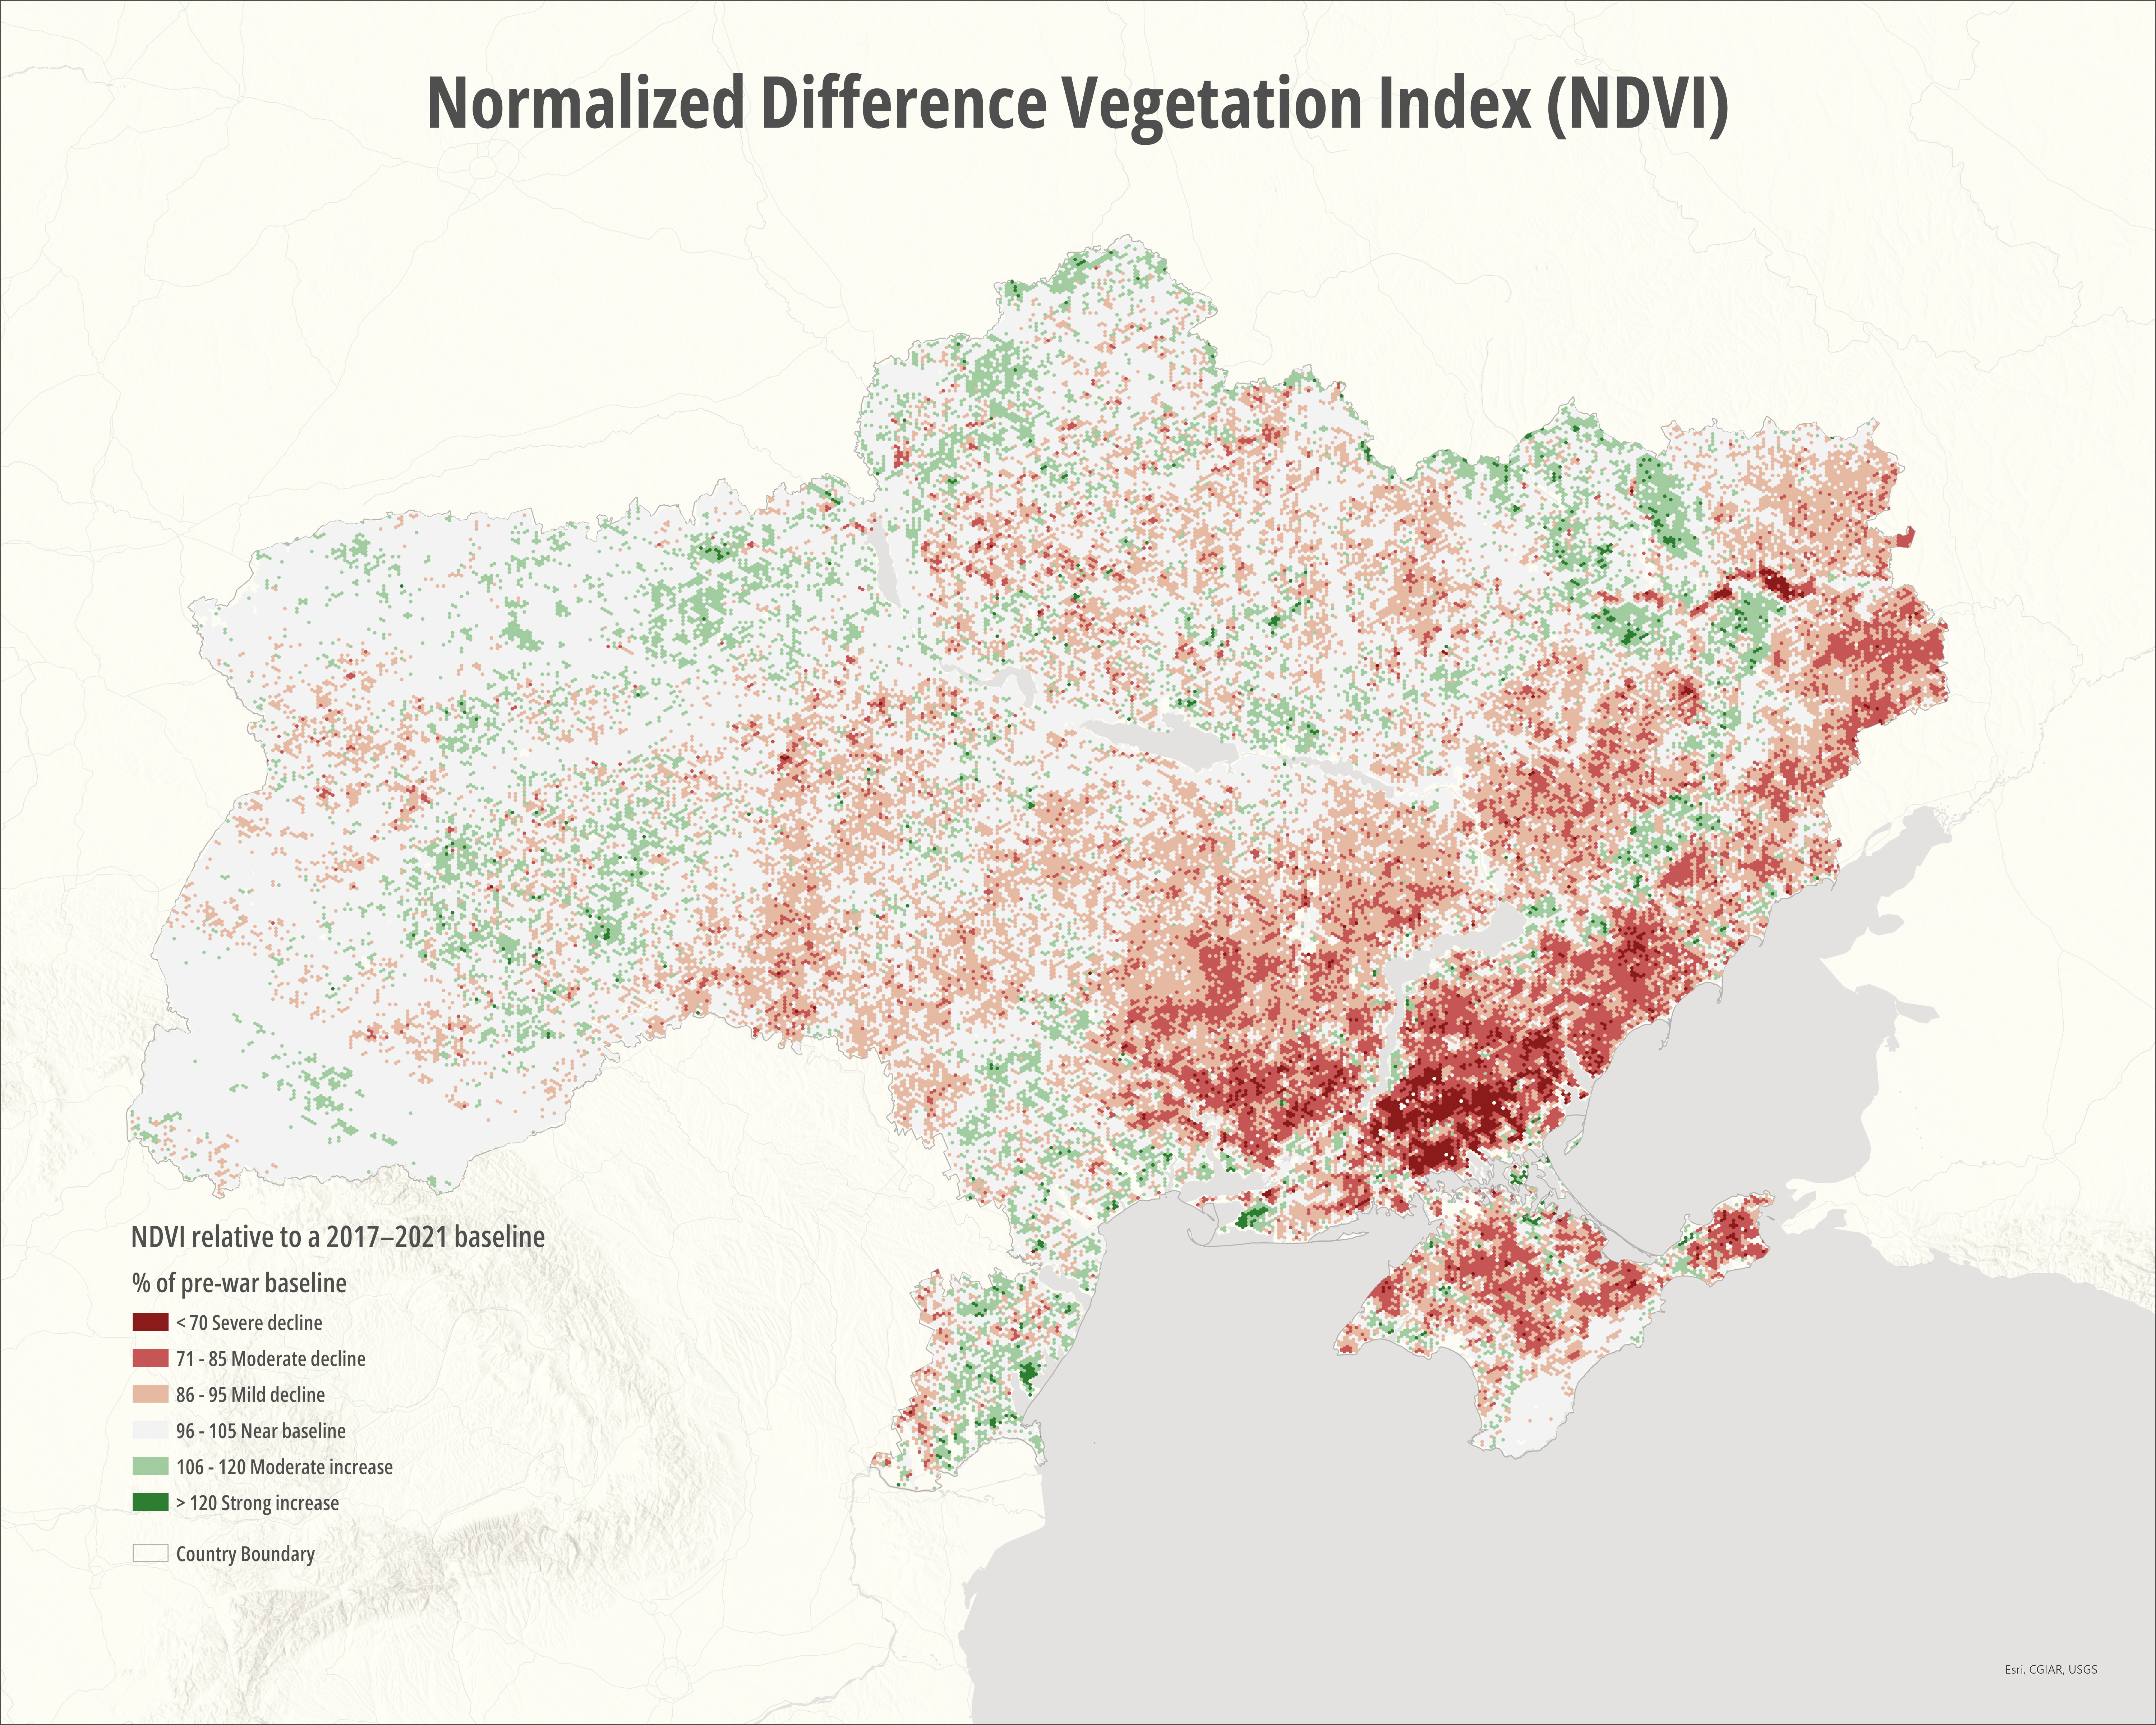
Vegetation indicators derived from NDVI analysis show spatial variation across agricultural landscapes. NDVI values reflect vegetation productivity and seasonal growth patterns. In some regions affected by sustained military activity, NDVI patterns indicate localized disturbances that may reflect changes in agricultural activity, land abandonment, or land-surface disruption.
Figure 5. below
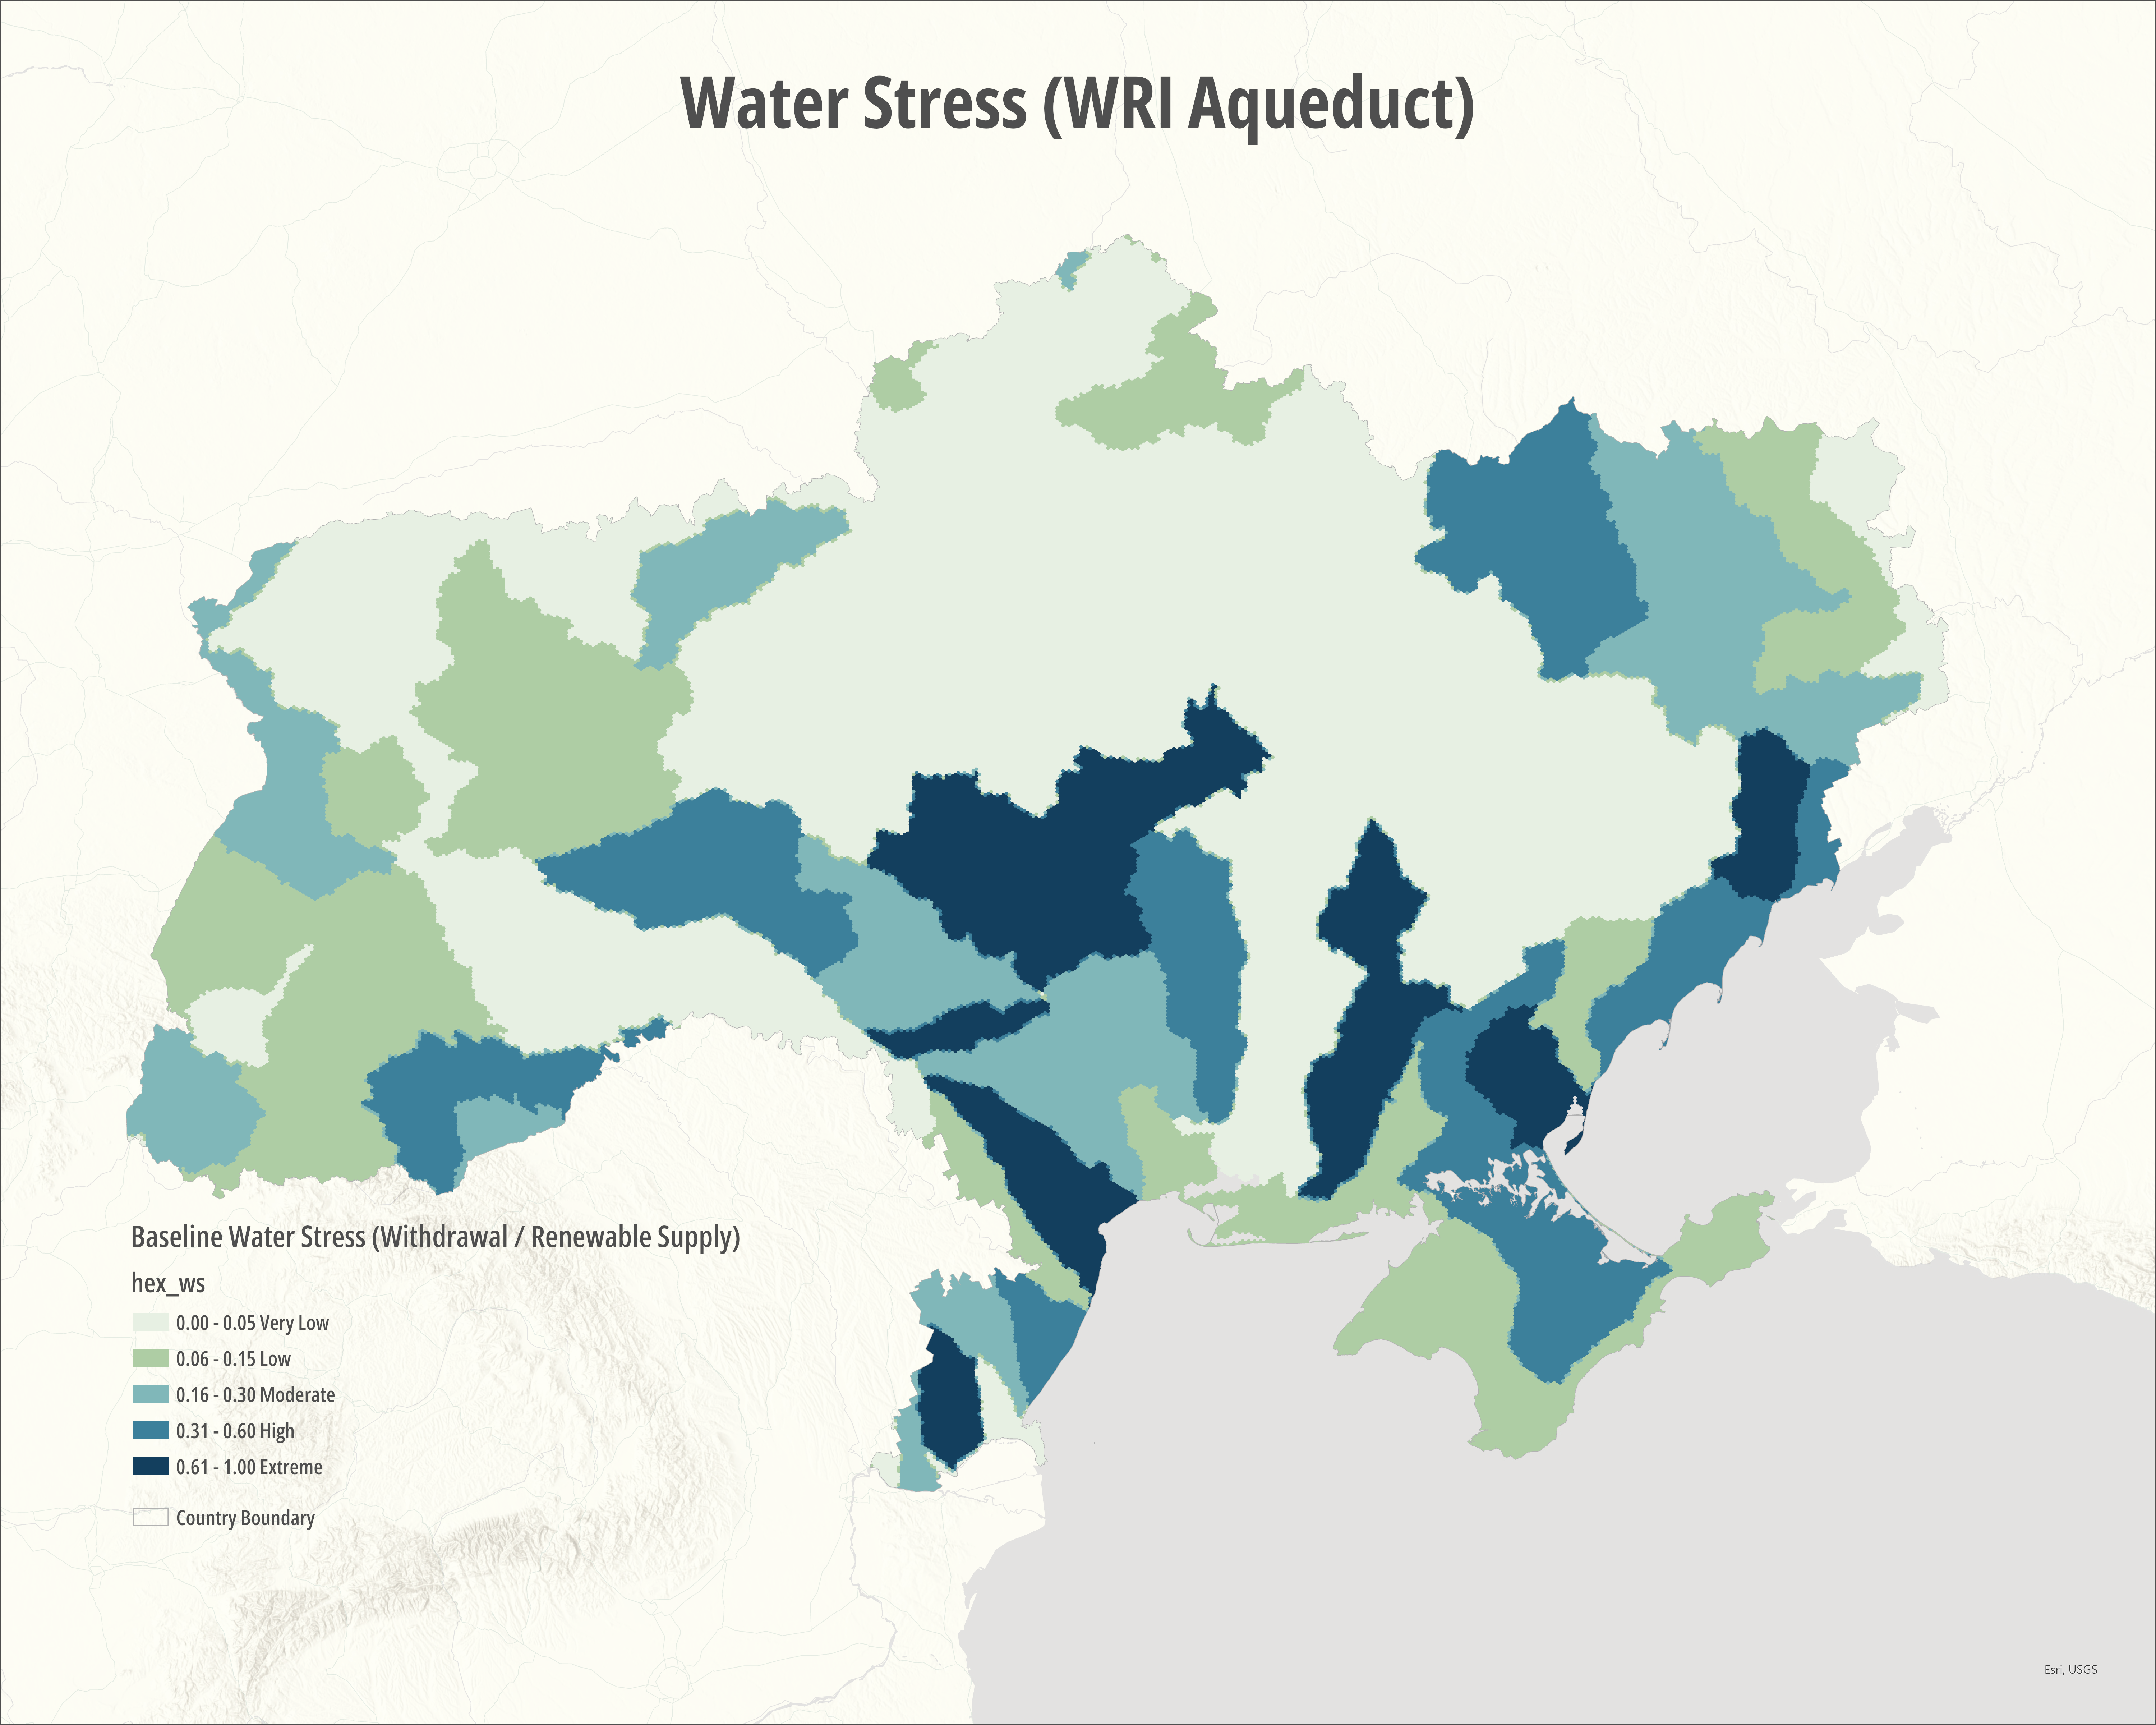
Water stress indicators derived from the Aqueduct dataset provide additional context regarding baseline environmental conditions. Parts of southern and eastern Ukraine exhibit relatively higher baseline water stress compared to other regions. Although these indicators do not directly measure wartime damage to water systems, they highlight areas where environmental constraints may interact with infrastructure disruption.
Figure 6. below
Taken together, these environmental indicators illustrate how wartime impacts intersect with pre-existing environmental conditions. Environmental stressors may amplify the effects of infrastructure disruption, particularly in regions where resource constraints already exist.
Temporal Dynamics of Infrastructure Disruption
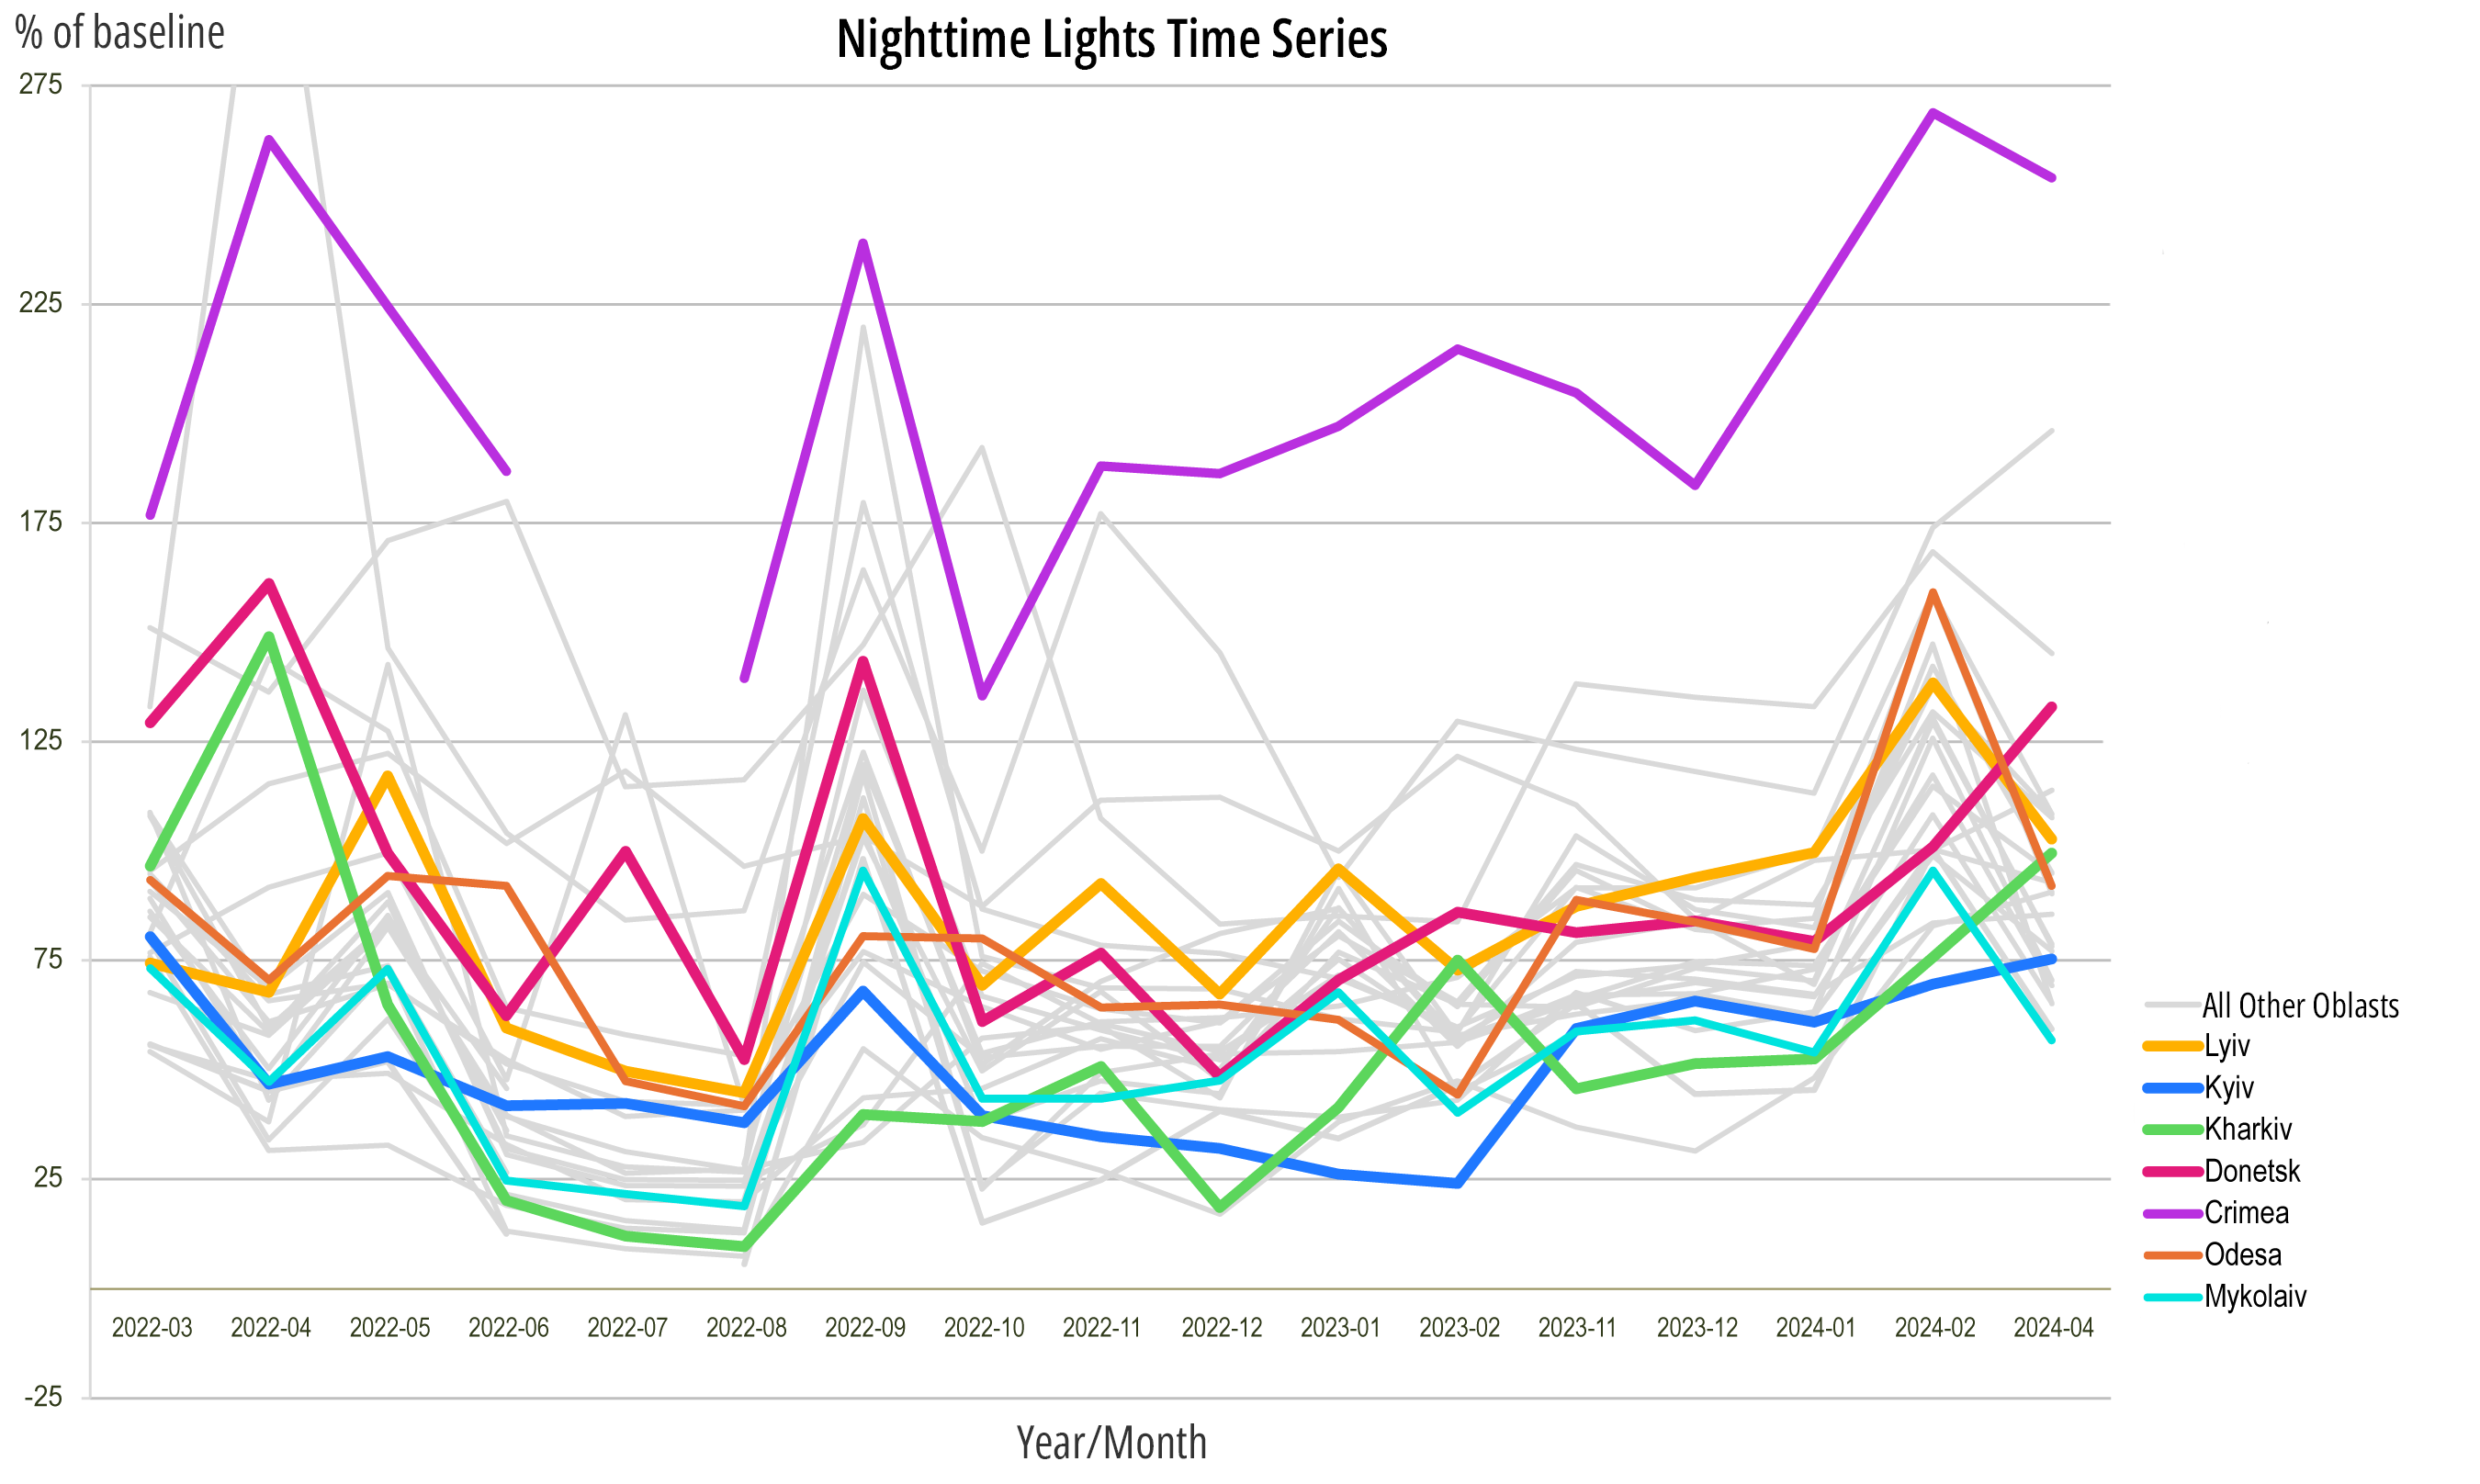
Time-series analysis of nighttime lights provides insight into how infrastructure activity has evolved during the conflict. Following the initial invasion in early 2022, many regions experienced noticeable declines in nighttime brightness relative to the 2021 baseline. In some areas, partial recovery can be observed over subsequent months, suggesting restoration of electricity supply or adaptation to infrastructure disruptions.
Figire 7. below
These temporal patterns illustrate the dynamic nature of infrastructure disruption during wartime. While some regions experience sustained declines in nighttime radiance, others exhibit fluctuating patterns reflecting cycles of infrastructure damage and repair. Such dynamics highlight the importance of monitoring infrastructure activity over time rather than relying solely on single observations.
Discussion
The results of this analysis demonstrate that civilian vulnerability in wartime Ukraine is shaped by the interaction of multiple spatial processes. While conflict events identify the locations of direct violence, infrastructure disruption and environmental stress extend beyond these areas, creating broader areas of vulnerability. Understanding these dynamics requires analytical frameworks capable of integrating multiple datasets representing infrastructure systems, environmental conditions, and population distribution.
Nighttime lights analysis provides particularly valuable insight into the spatial consequences of infrastructure disruption. Declines in nighttime brightness correspond closely with regions experiencing sustained military operations and infrastructure targeting. Because electrical systems operate as interconnected networks, disruptions to key nodes can affect large geographic areas. This network structure helps explain why nighttime lights declines extend beyond the immediate locations of recorded conflict events.
Environmental indicators further illustrate the broader consequences of warfare. Vegetation anomalies captured through NDVI analysis may reflect changes in agricultural activity or land use patterns associated with conflict. Air quality indicators highlight regional environmental pressures that may influence public health conditions, particularly in industrial regions. Water stress indicators provide additional context for understanding how environmental constraints may interact with wartime disruptions.
Population distribution patterns emphasize the human dimension of these disruptions. Although large numbers of people have been displaced by the conflict, many major cities remain densely populated. Infrastructure disruptions affecting electricity supply or transportation systems therefore have the potential to affect large civilian populations. Regions where population density coincides with infrastructure instability may represent areas where humanitarian challenges are particularly severe.
The integration of multiple indicators within a hexagonal spatial framework provides a useful method for identifying vulnerability hotspots. By aggregating diverse datasets to a common spatial grid, the analysis enables direct comparison of patterns across infrastructure, environmental, and population indicators. This approach highlights regions where multiple forms of disruption intersect.
Several limitations should be considered when interpreting the results of this project. First, many of the indicators used represent proxy measures rather than direct observations of specific processes. Nighttime lights decline may reflect multiple factors including infrastructure damage, population displacement, or reduced economic activity. Similarly, NDVI anomalies may arise from seasonal variation or climate conditions in addition to conflict related disruption.
Second, several datasets used in the analysis are modeled rather than purely observational. Atmospheric reanalysis datasets such as CAMS combine numerical models with observational data to estimate atmospheric conditions. While these models provide valuable spatial coverage, they may introduce uncertainty in regions where observational data are limited.
Despite these limitations, integrating multiple independent datasets provides a strong framework for examining spatial patterns of wartime vulnerability. The convergence of infrastructure disruption, environmental stress, and population exposure highlights regions where civilians may face compounded challenges during the conflict and in subsequent recovery phases.
Conclusions
This project examined spatial patterns of civilian vulnerability in Ukraine by integrating indicators of infrastructure disruption, environmental stress, conflict intensity, and population exposure within a unified geospatial framework. Satellite derived nighttime lights revealed substantial infrastructure disruption in eastern and southern regions of the country, while conflict event data highlighted the geographic concentration of violent activity. Environmental indicators provided additional context regarding vegetation dynamics, air quality conditions, and baseline water stress.
The results demonstrate that wartime vulnerability is shaped not only by the locations of violent events but also by the broader interaction of infrastructure systems, environmental conditions, and population distribution. Regions where these factors intersect represent potential vulnerability hotspots where civilian populations may face increased challenges related to infrastructure access, environmental quality, and recovery prospects.
More broadly, the project illustrates the value of integrating satellite remote sensing, environmental indicators, and conflict event data for analyzing the spatial consequences of armed conflict. Advances in geospatial data and analytical methods now allow researchers to monitor complex socio-environmental processes at national and regional scales. Such approaches provide important insights into understanding the humanitarian and environmental dimensions of modern warfare.
References
1. Birch, C. P. D., Oom, S. P., & Beecham, J. A. (2007). Rectangular and hexagonal grids used for observation, experiment and simulation in ecology. Ecological Modelling, 206, 347–359.
2. Elvidge, C. D., Baugh, K., Zhizhin, M., & Hsu, F. C. (2017). VIIRS night-time lights. Remote Sensing, 9(9), 922.
3. Hofste, R. W., Reig, P., & Schleifer, L. (2019). Aqueduct 3.0: Updated decision-relevant global water risk indicators. World Resources Institute.
4. Inness, A., et al. (2019). The CAMS global reanalysis of atmospheric composition. Atmospheric Chemistry and Physics, 19, 3515–3556.
5. Lawrence, M. J., et al. (2015). The effects of modern war and military activities on biodiversity and the environment. Environmental Reviews, 23, 443–460.
6. Machlis, G. E., & Hanson, T. (2011). Warfare ecology. BioScience, 61, 729–736.
7. Pettorelli, N., et al. (2005). Using the satellite-derived NDVI to assess ecological responses to environmental change. Trends in Ecology & Evolution, 20, 503–510.
8. Raleigh, C., Linke, A., Hegre, H., & Karlsen, J. (2010). Introducing ACLED: An armed conflict location and event dataset. Journal of Peace Research, 47, 651–660.
9. Román, M. O., et al. (2018). NASA’s Black Marble nighttime lights product suite. Remote Sensing of Environment, 210, 113–143.
10. Tatem, A. J. (2017). WorldPop, open data for spatial demography. Scientific Data, 4, 170004.
11. Zheng, Z., et al. (2022). Estimates of power shortages and affected populations in Ukraine using nighttime lights. Remote Sensing, 14(19), 4793.